- DATE:
- AUTHOR:
- SAP LeanIX Product Team
Rollup layout in the Matrix and Landscape Reports
In modern enterprises, heatmap reports can become very large, making it difficult for users to conveniently consume so much data to get insights. Moreover, it is difficult to get an overview of who uses what application for which purpose without having to scroll horizontally and vertically. To reduce this effort, the Rollup layout mode for Matrix and Landscape reports has been introduced.
By changing the layout mode from 'Detail' to 'Rollup,' users visualize a quantitative overview with direct insights into the state of underlying Fact Sheets. Each aggregated cell of Applications is grouped by the Fact Sheet type on the X-axis and Y-axis and the selected 'View' (e.g., the number of applications used by user groups in Europe and is 'mission critical' to 'Corporate Services' Business Capability).
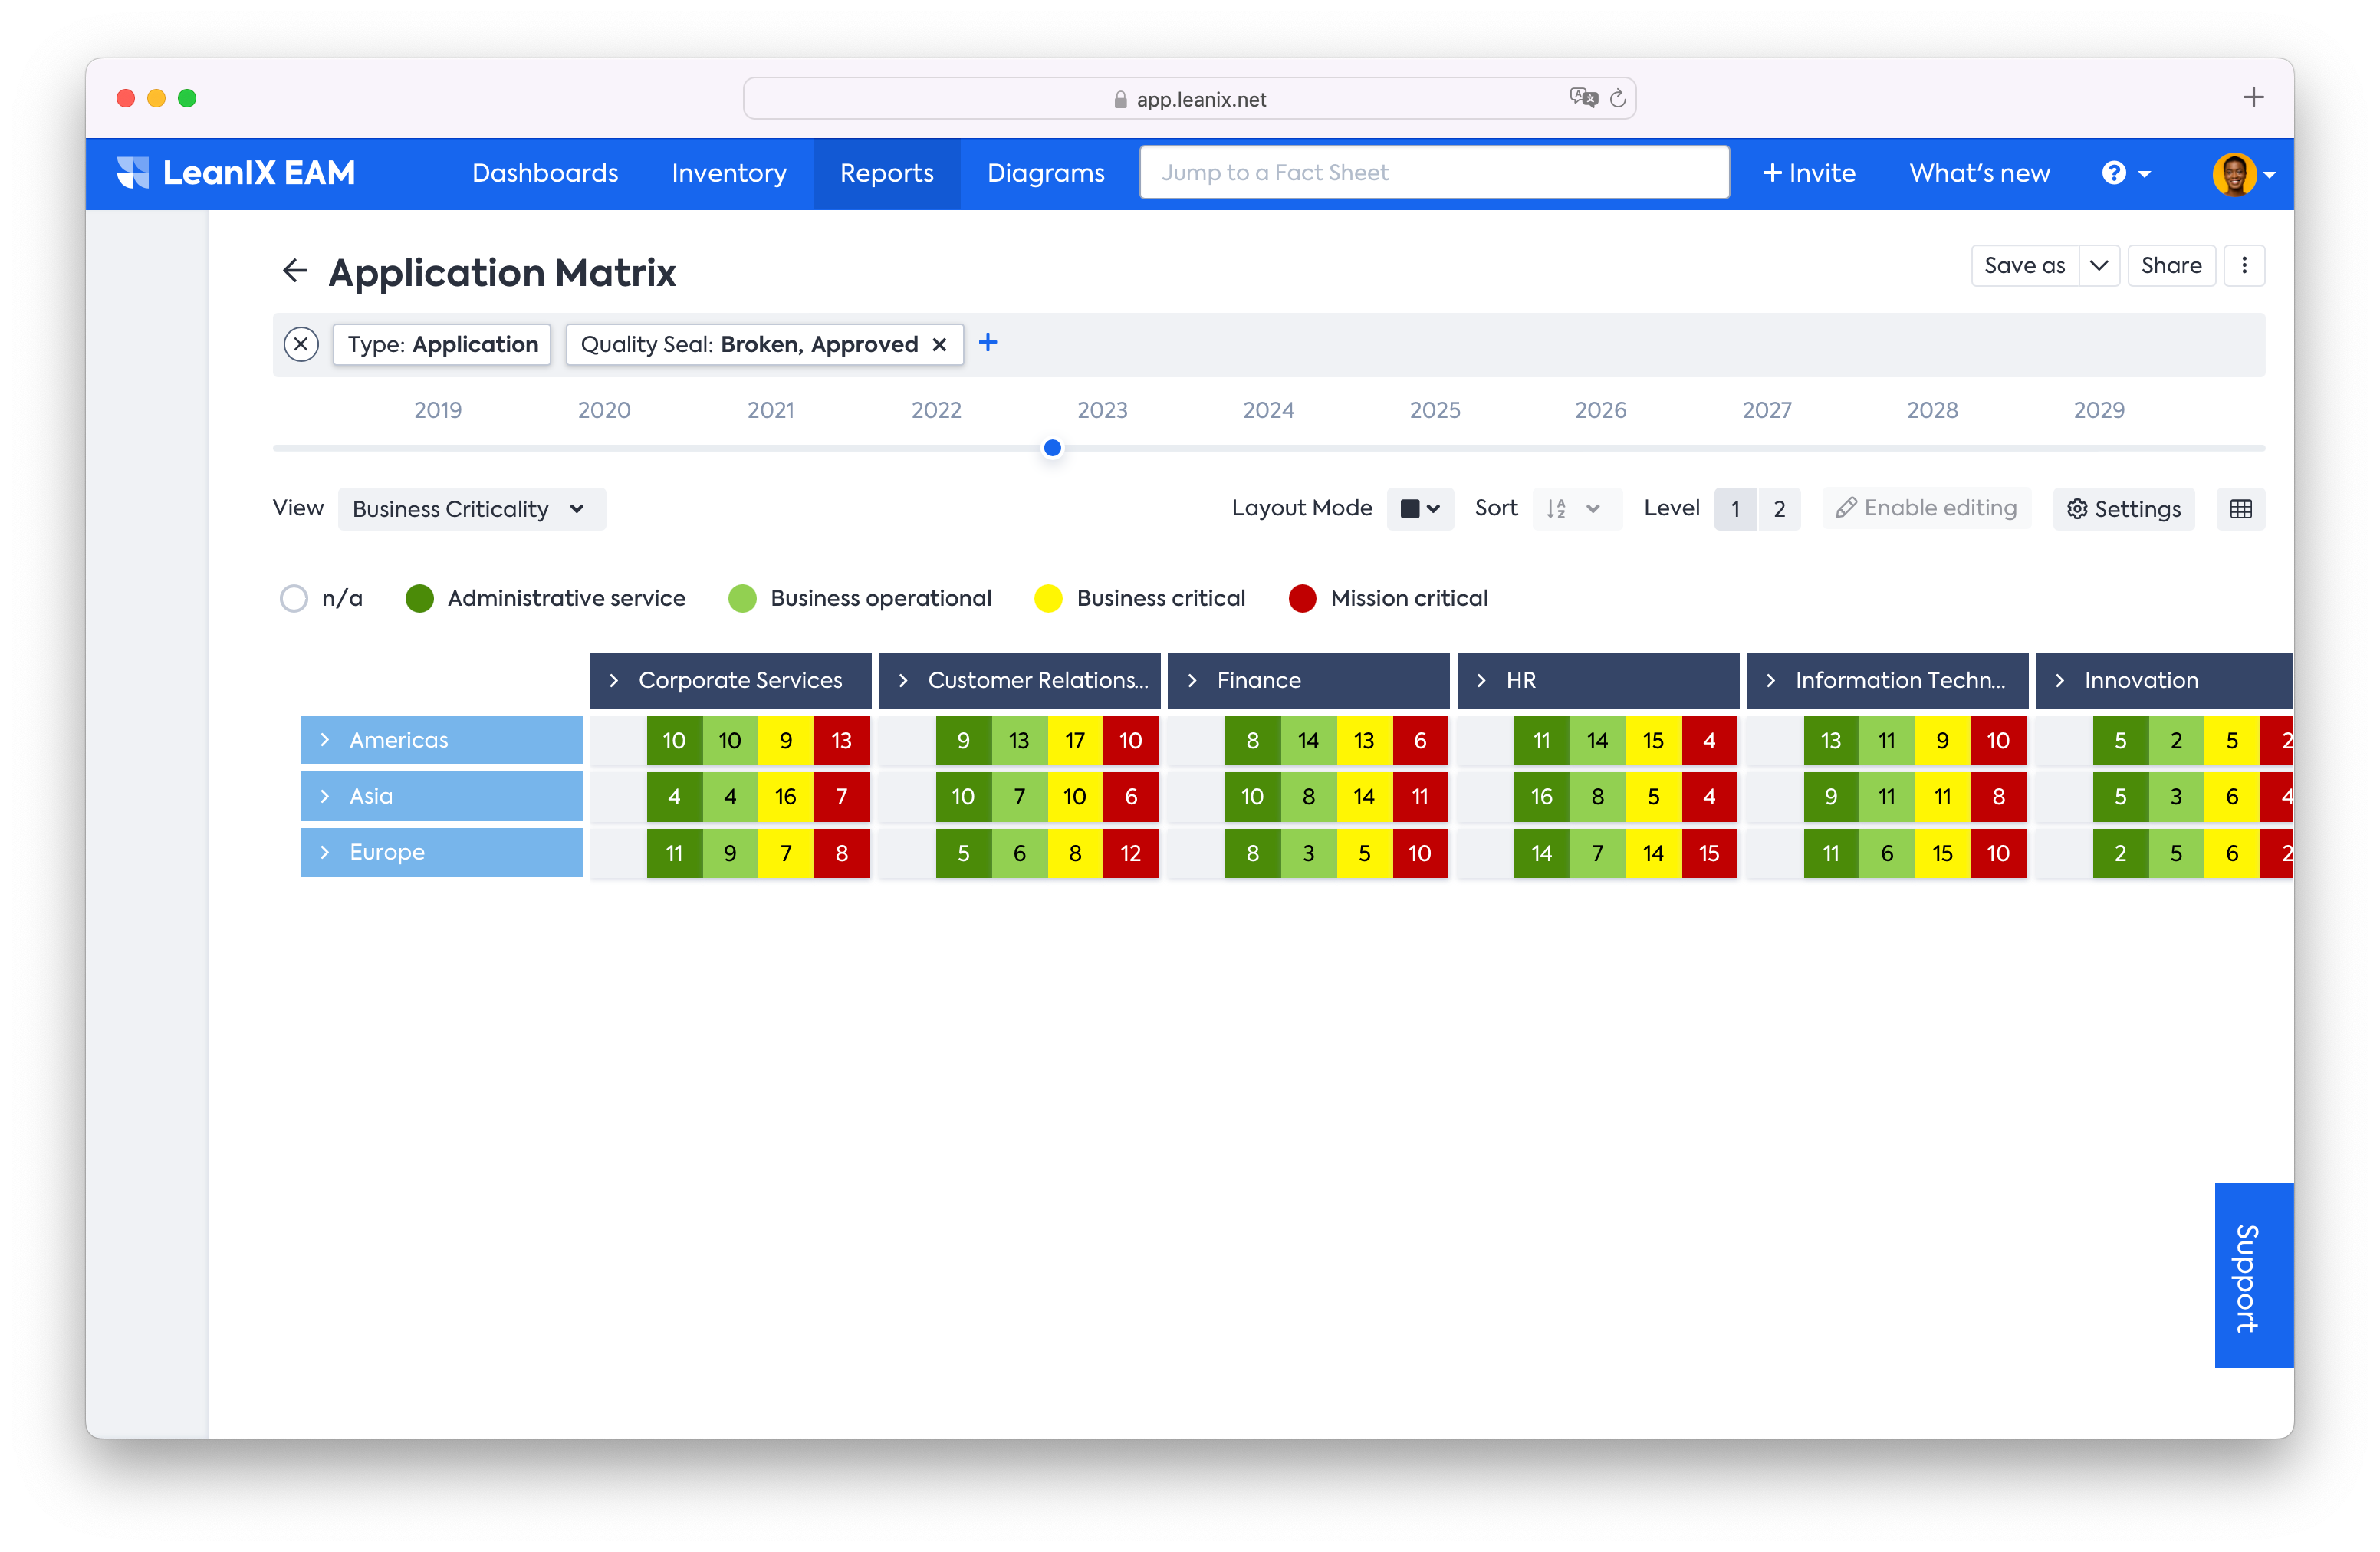
The rollups naturally work together with our functionality to expand and collapse columns and rows on the coordinate axis and the level selector. It is also possible to export this report as a one-pager printable image to reuse in the presentation tool of your choice. On clicking on one of the cells, the side panel opens with this list of Fact Sheets which can be viewed in the Inventory or on a separate Matrix/Landscape report. This functionality will be impactful for users in the following way:
For high-level visualization within the tool, reducing a considerable amount of time to scroll through the reports for insights.
For decision-making during architecture analysis and presenting it to the management as a one-pager printable report.
To save considerable effort to create a high-level view of the IT landscape in Excel or Power BI.