- DATE:
- AUTHOR:
- SAP LeanIX Product Team
KPI dashboard for Application Rationalization
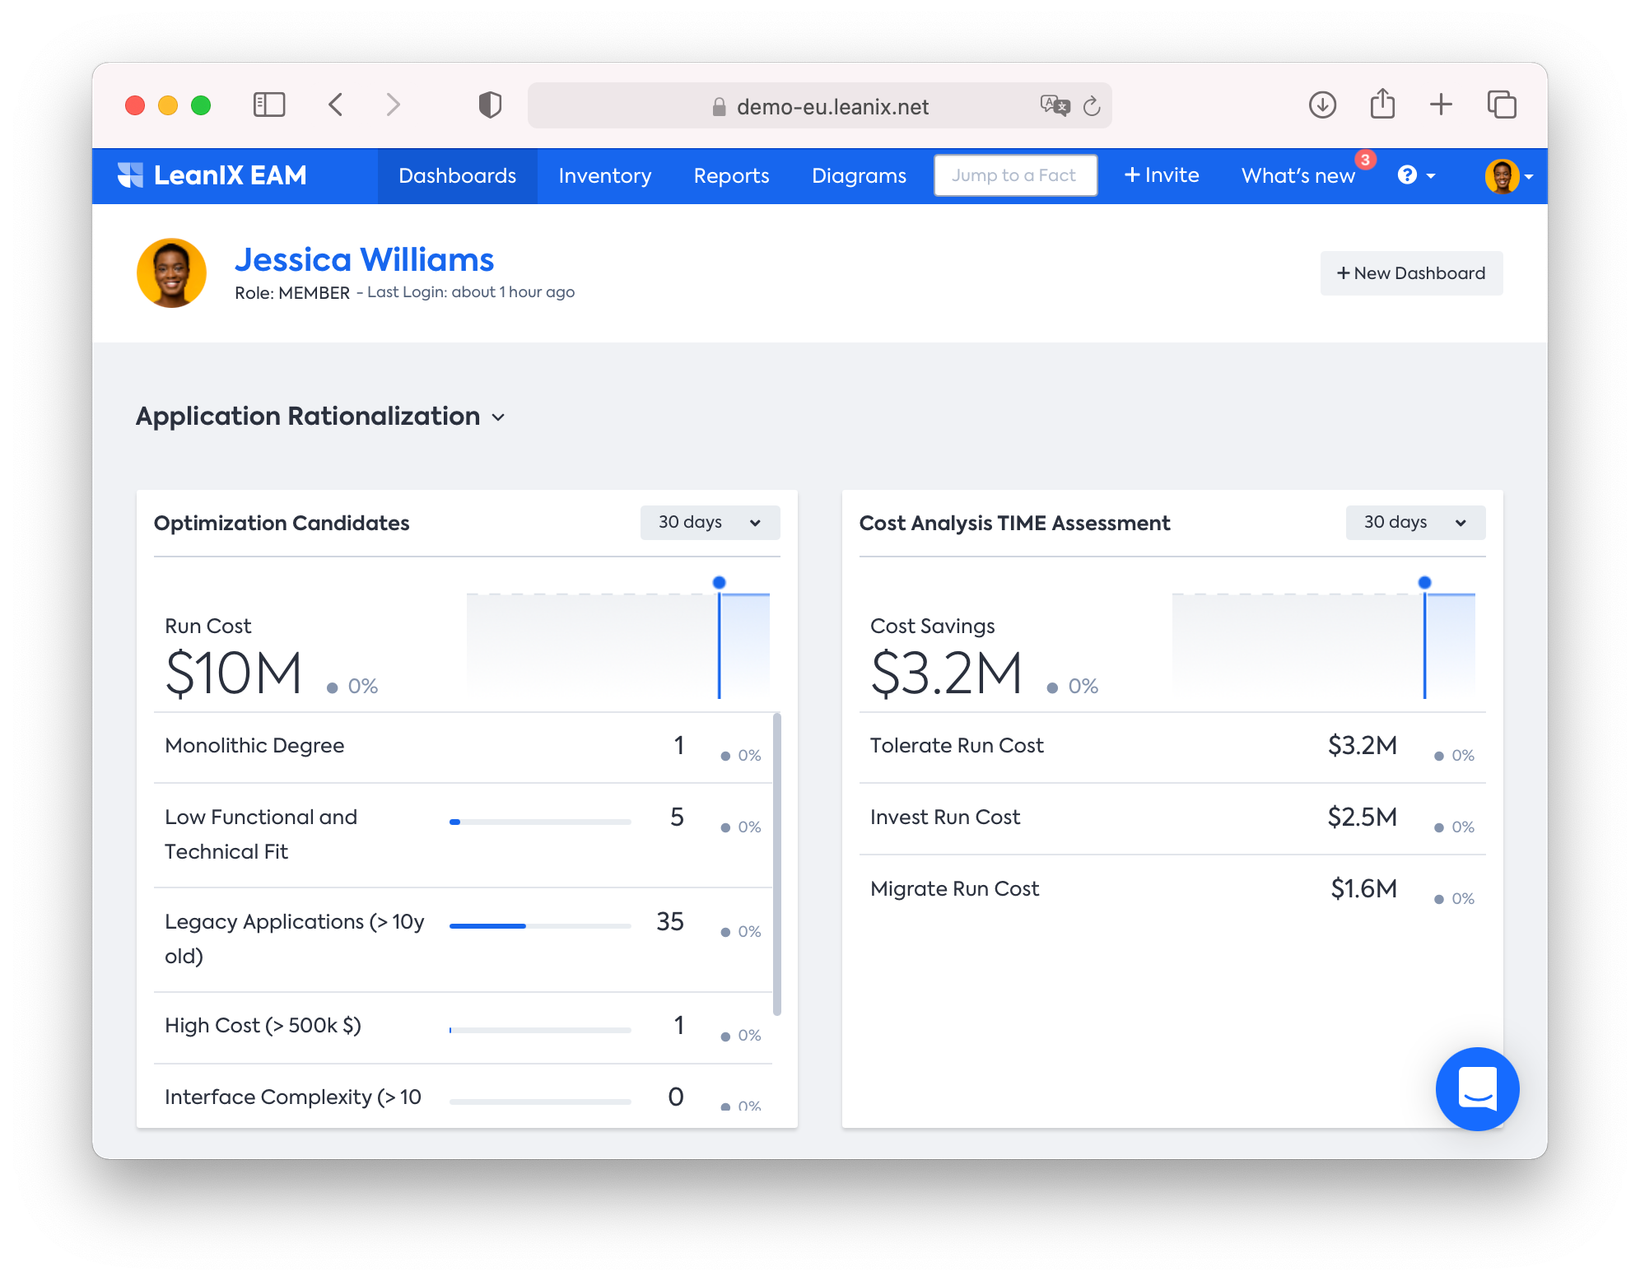
With the release of the KPI dashboard for Application Rationalization, a third predefined dashboard is now available for workspaces with the APM module. The dashboard contains four different panels with KPI charts for the core use cases of the LeanIX EA Management.
1. Optimization Candidates: The indicators in this panel display the targets to look at during rationalization. The Run Cost indicates all the applications' total run cost based on the total annual cost attribute on the relation between IT Components and Applications.
2. TIME assessment: This panel uses Gartner's best practice TIME methodology to manage the portfolio strategy on a high level.
3. Cost Analysis: The indicators in this panel consider the TIME classification from the previous panel and add up the "Total annual cost" attribute of the relation between IT Components and Applications for each of the TIME categories.
4. Data quality: This panel displays the data quality of the applications in the portfolio by summarizing completion score information and availability of key Fact Sheet data (e.g., lifecycles, relations to Business Capabilities, and User Groups).
Further description of the Application Rationalization panel is provided in the LeanIX user documentation.
It is a prerequisite to enable the Portfolio Strategy extension for the KPI dashboard for Application Rationalization. Workspace admins can activate it in the 'Optional Features & Early Access' section of the admin area. Though the KPI dashboard is listed in the "Predefined" group in the dashboard selection and can't be edited, users can create copies to apply modifications. Admins can deactivate the KPI dashboard in the administration area's "Settings" section mentioned as "Out-of-the-box Dashboards."