- DATE:
- AUTHOR:
- SAP LeanIX Product Team
Improving data quality within your VSM workspace
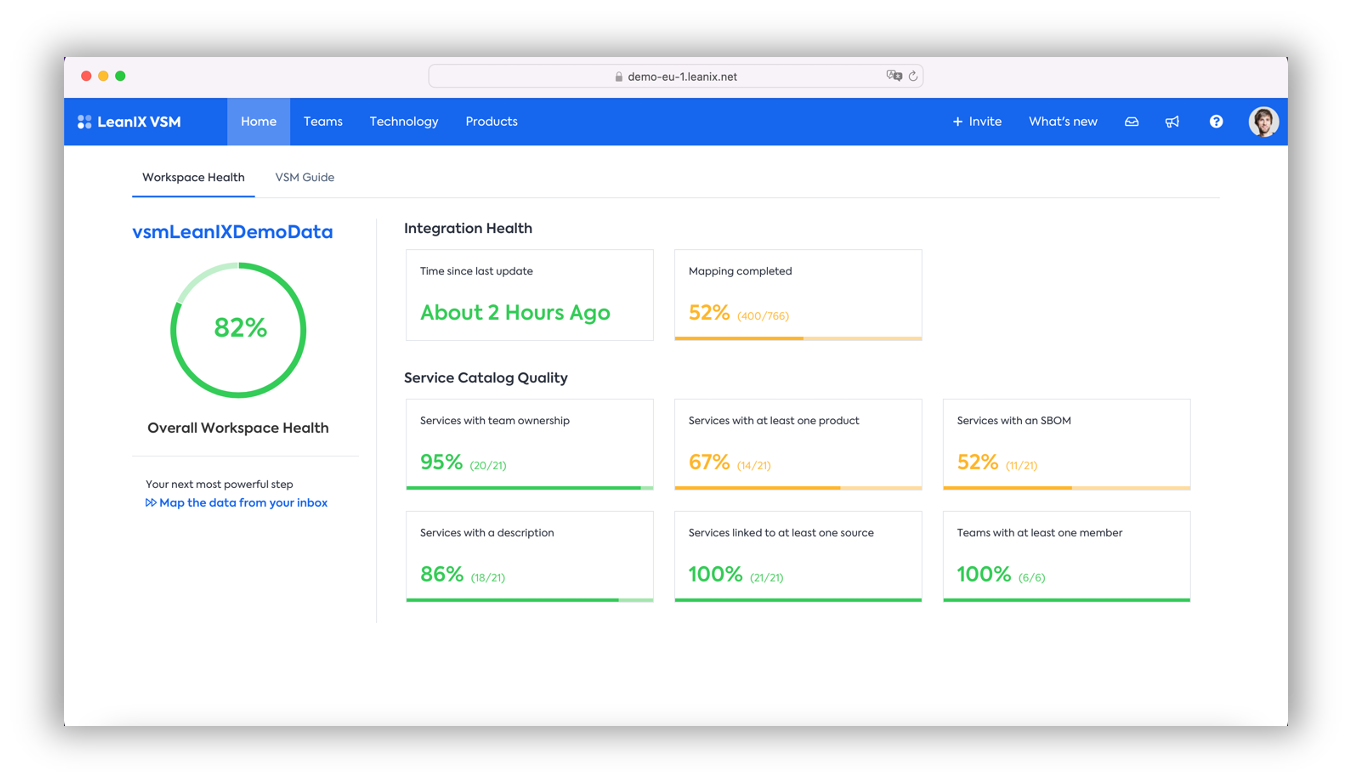
VSM now provides its admin users with a clear view of how to improve data quality in their workspace. The workspace health metrics are a collection of KPIs that determine how valuable your VSM workspace is to users.
Once the onboarding guide is completed, the health metrics dashboard appears as the default screen on the home tab. The dashboard reads from top to bottom allowing you to identify focus areas for your initiatives around VSM. Nine metrics give insights into the most important data points of a healthy workspace.
An overall health score summarizes the metrics with equal weight. Metrics that are below 50%, between 50% and 80% or above 80% will appear red, yellow or green respectively.
To make it easier, we suggest a “next most powerful step” depending on your KPIs, so you always know what to do next and guide the admin towards the next action they should be focussing on.
Note: The dashboard is only visible to VSM admins.
In case you have any questions about how to improve a metric, please reach out to the LeanIX Customer Success team.