- DATE:
- AUTHOR:
- SAP LeanIX Product Team
- RELATED ROADMAP ITEMS:
- Event-driven DORA calculation and UI
Data-driven engineering with DORA metrics
We are excited to now support Accelerate (DORA) metrics in Value Stream Management (VSM) to help developer teams increase transparency and optimize software delivery efficiency.
Gathering baseline metrics from your tech stack can happen in two ways:
Either you leverage our dedicated API that enables event-driven integration to your code repository systems, CI/CD pipelines, and tracking systems of choice
Or, you use our out-of-the-box GitHub integration, which calculates Deployment Frequency and Lead Time for changes based on ingested change and release events.
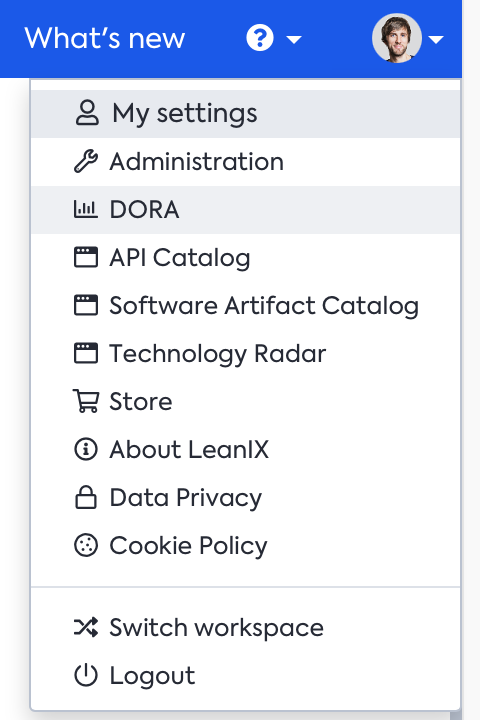
Once data is sent to the VSM workspace, you can access the DORA metrics by clicking on your profile picture and selecting “DORA” in the drop-down.

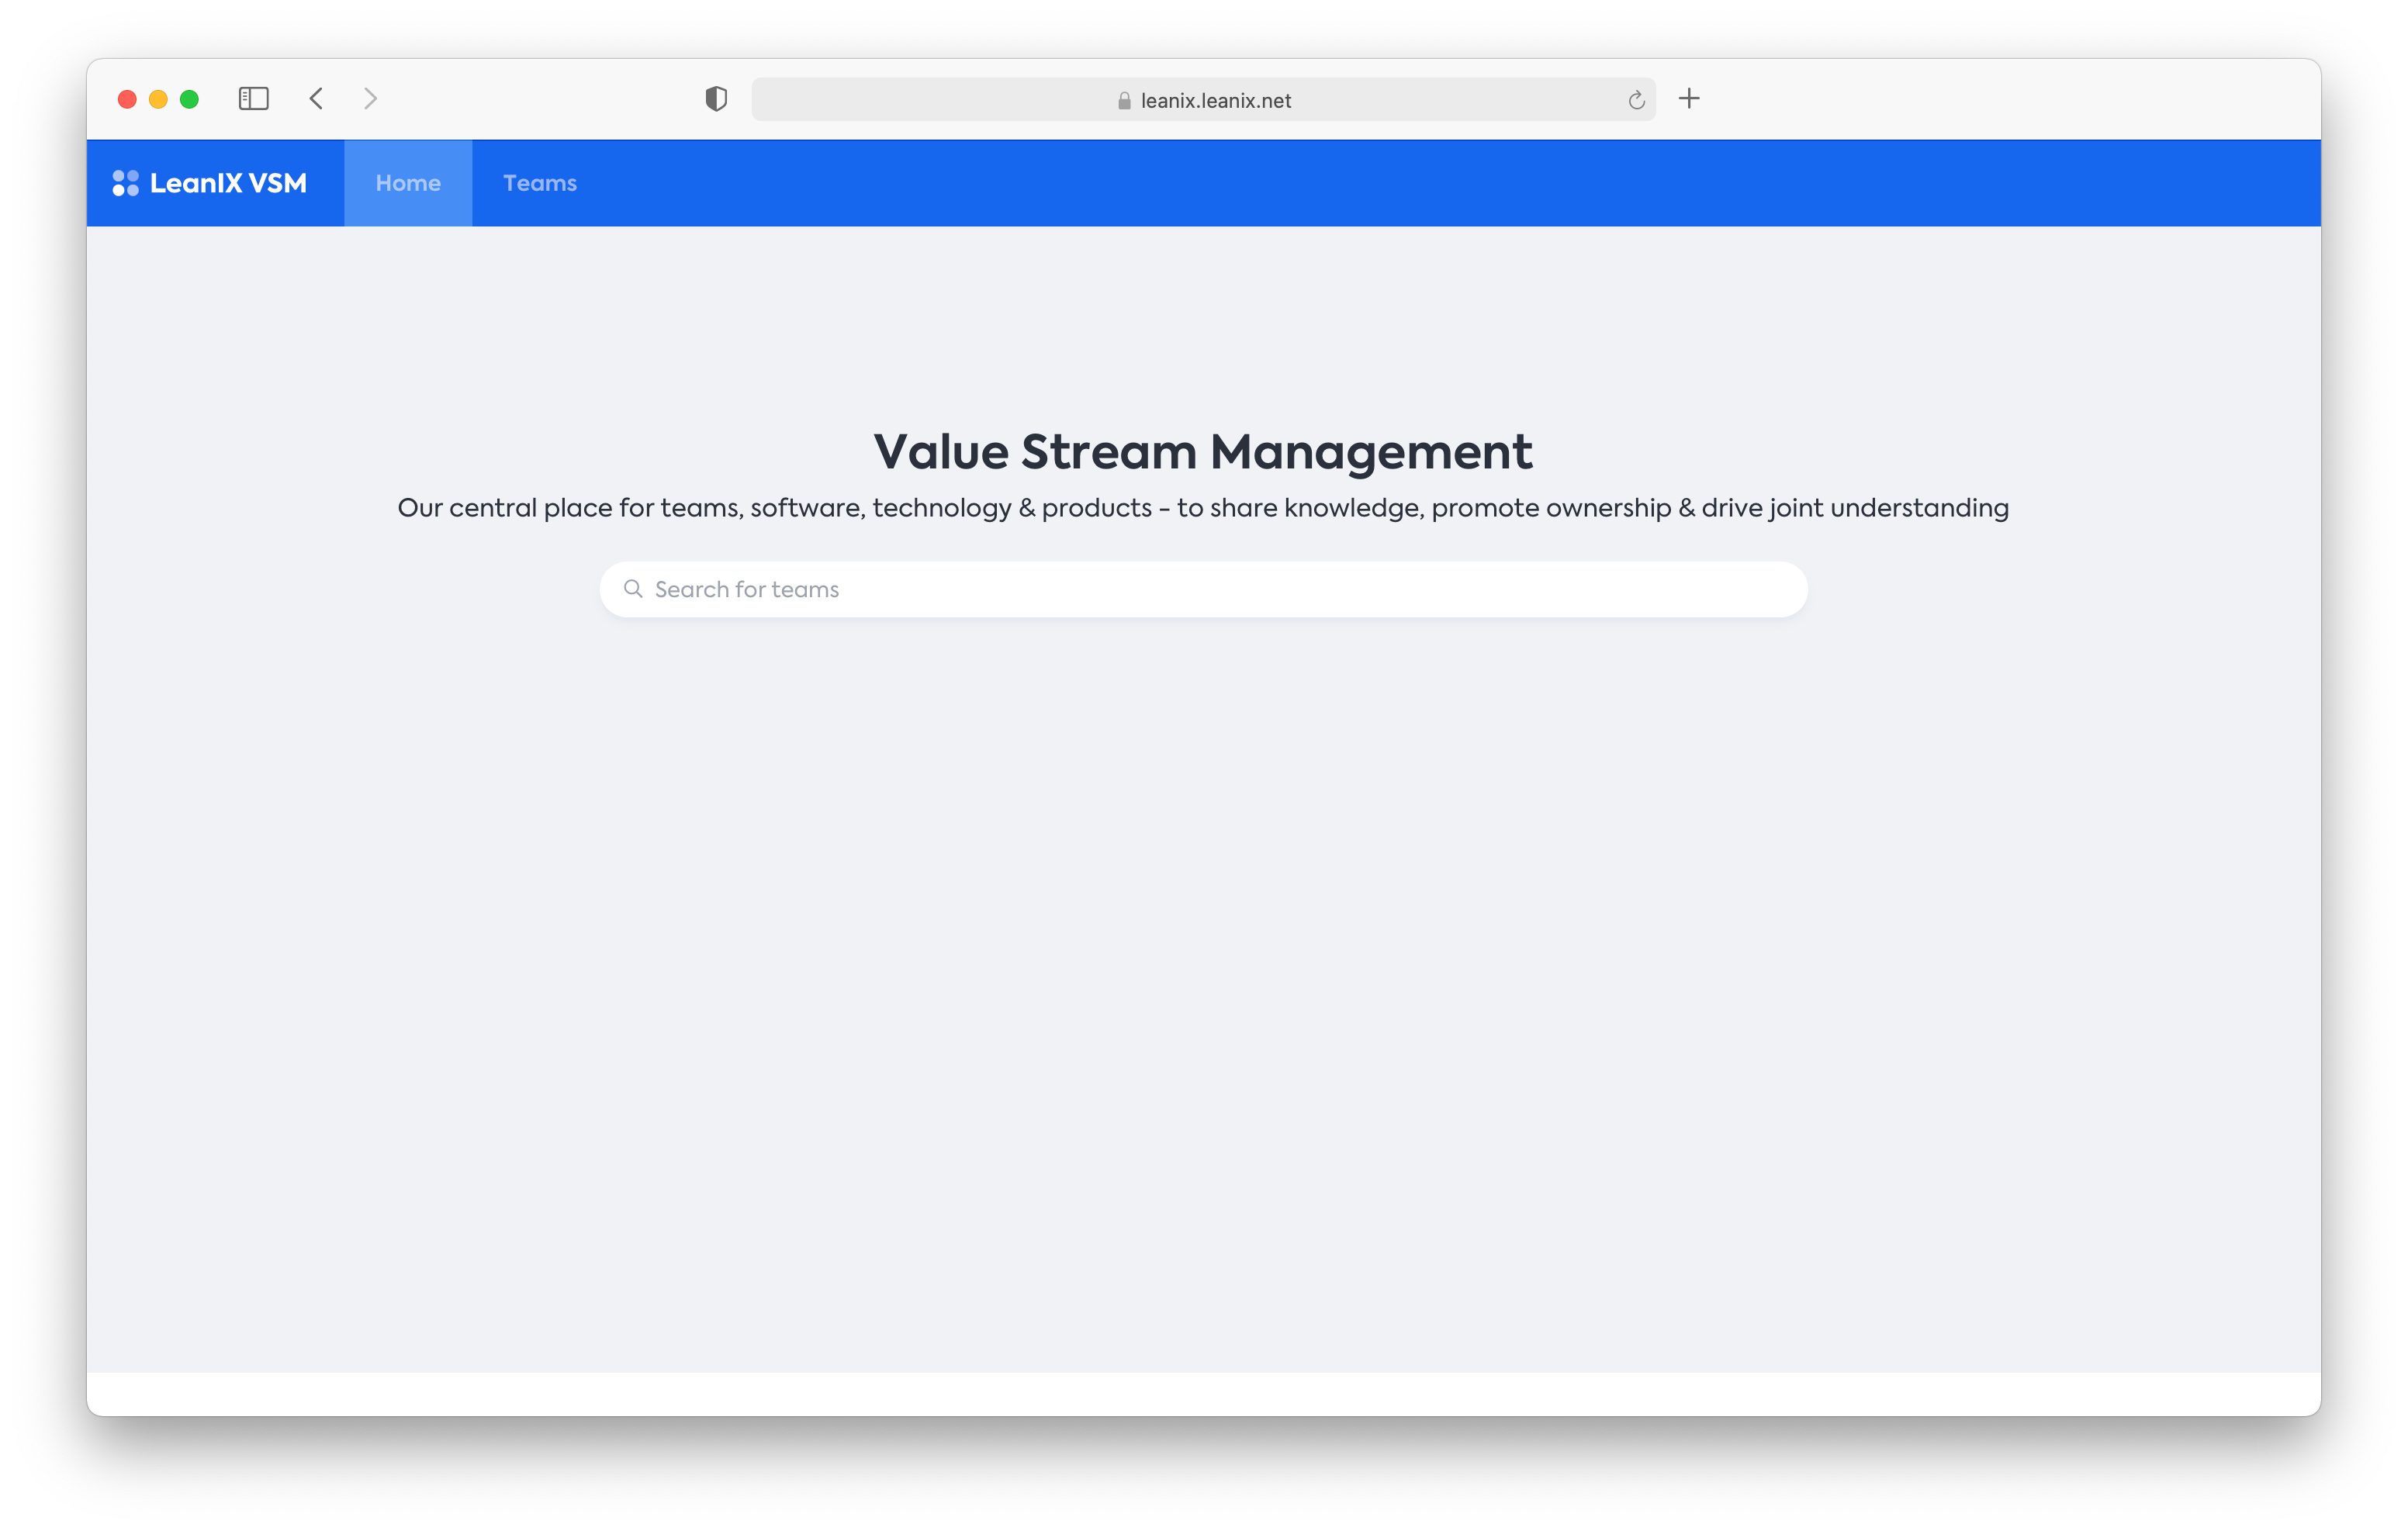
This will lead you to a new interface of VSM that focuses on teams and their respective Software Artifacts.
By either entering your team’s name in the search bar

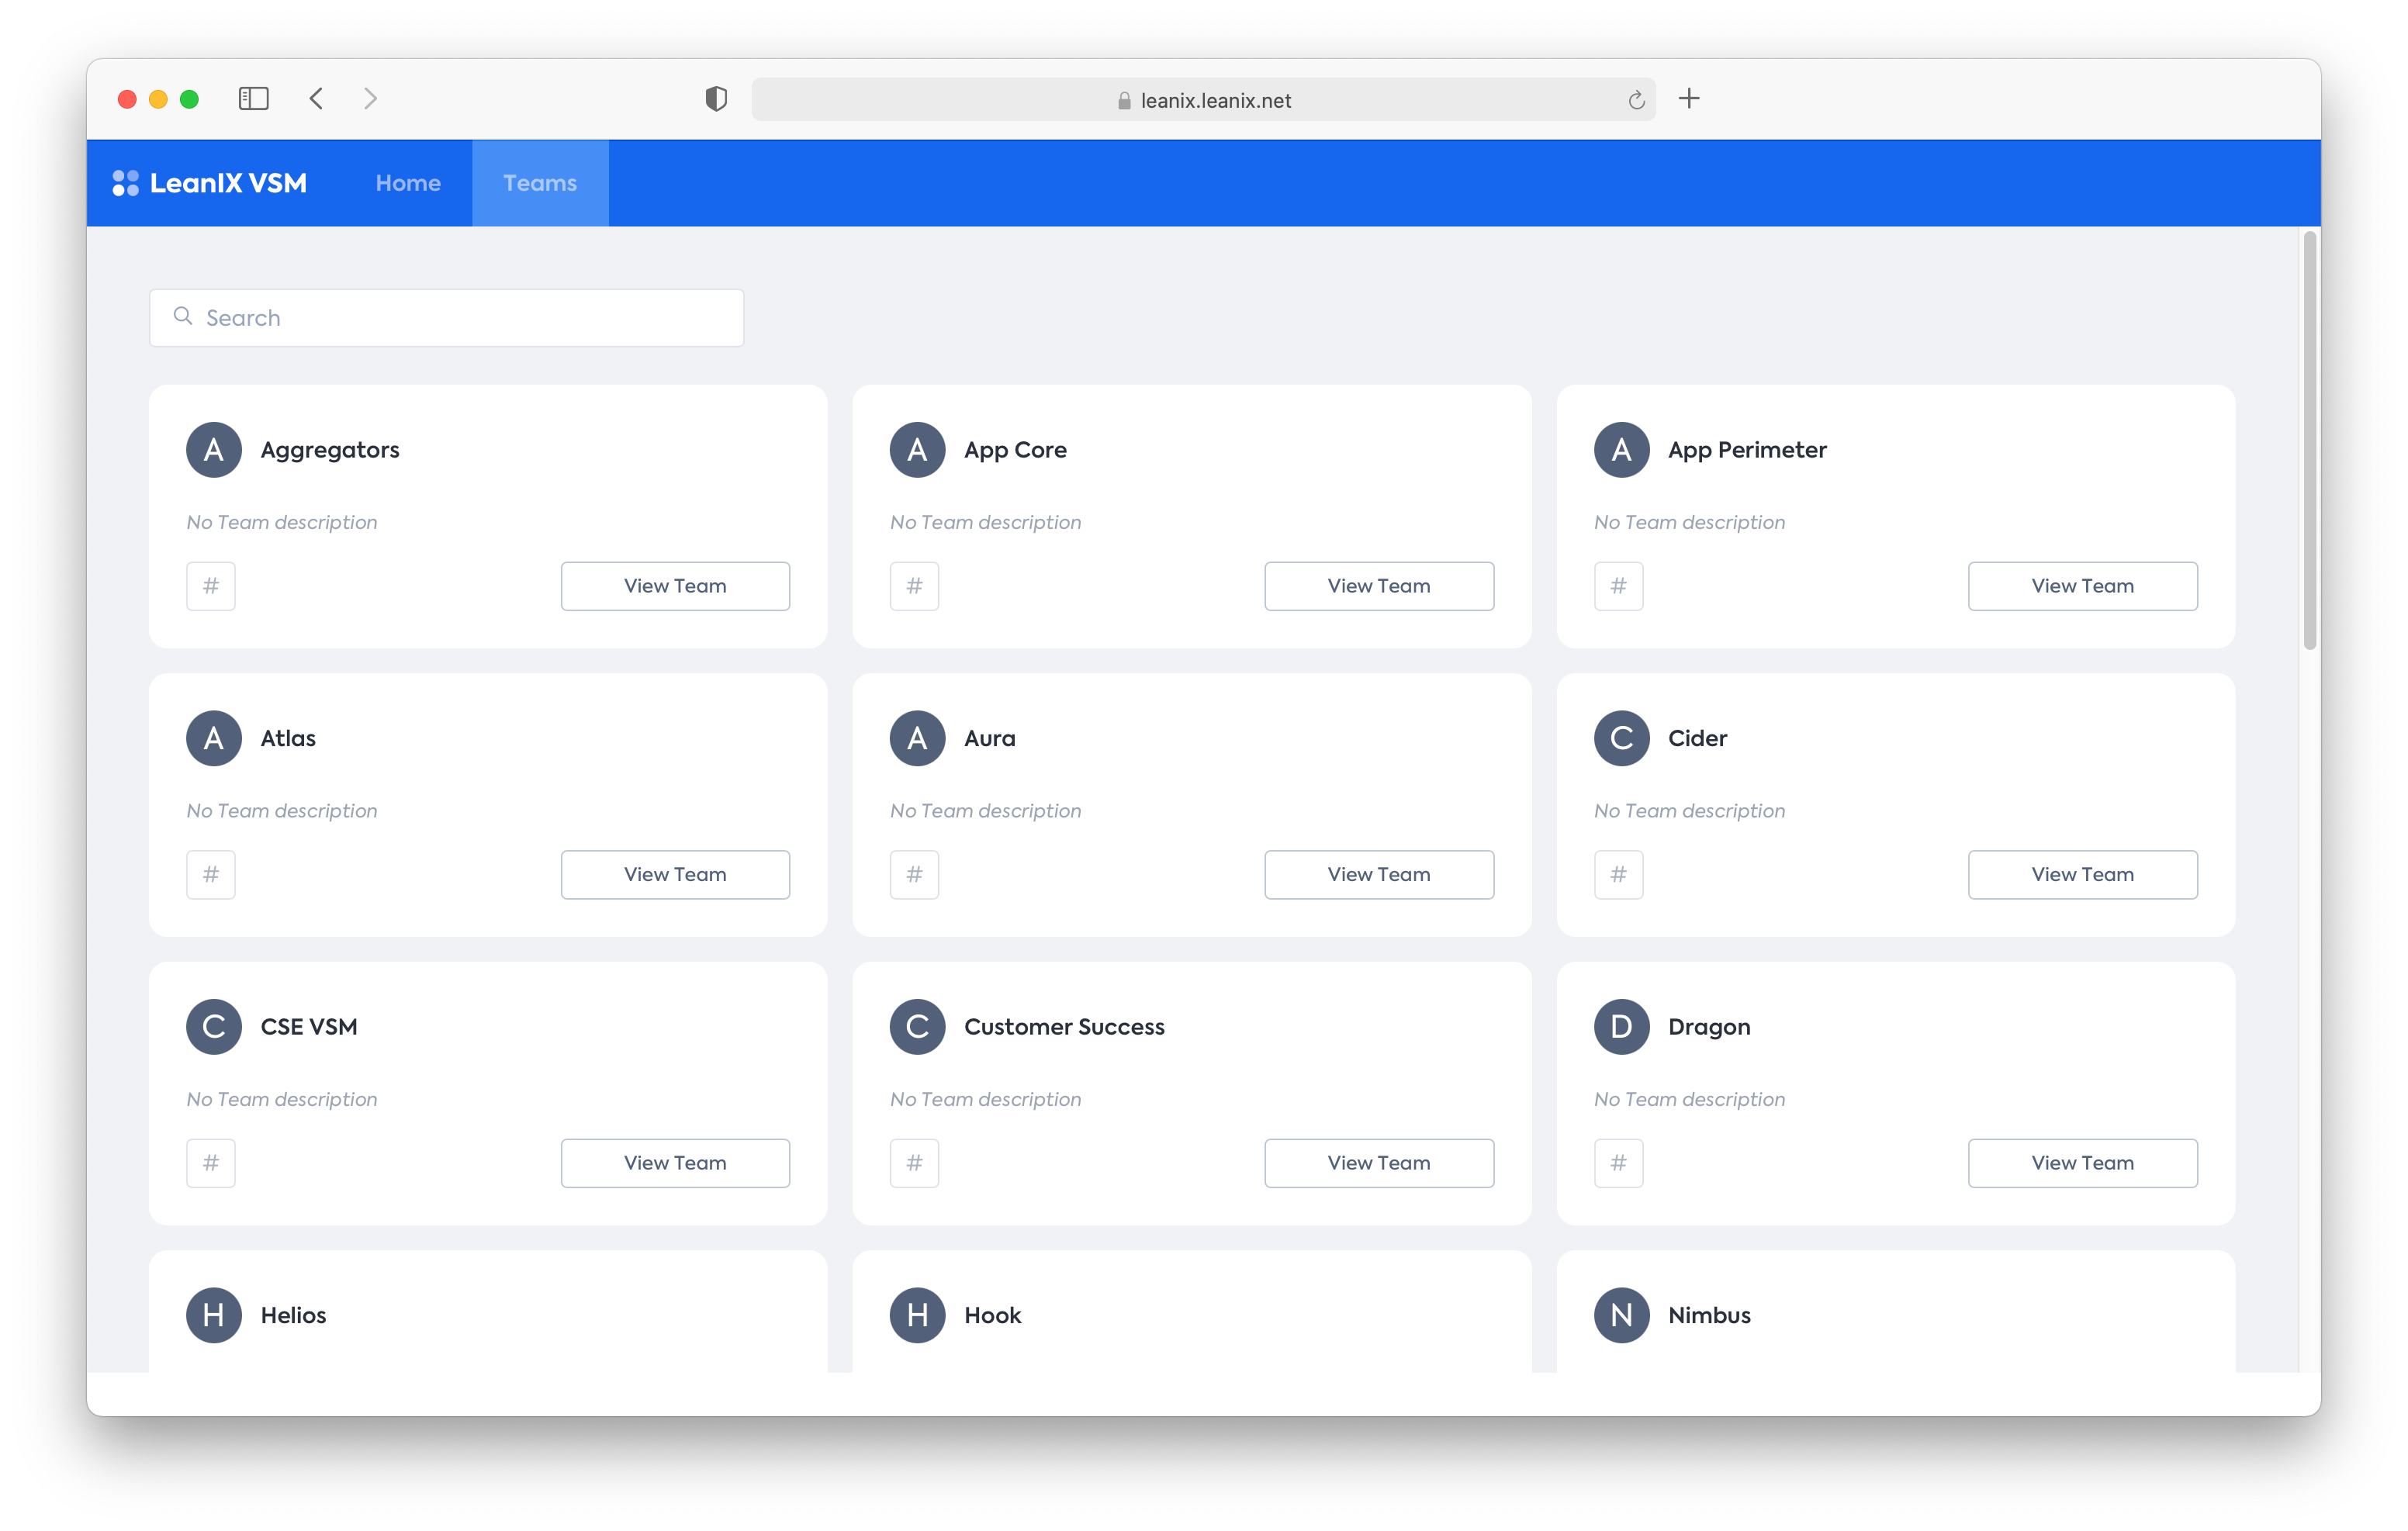
or selecting your team from the Teams tab in the navigation bar

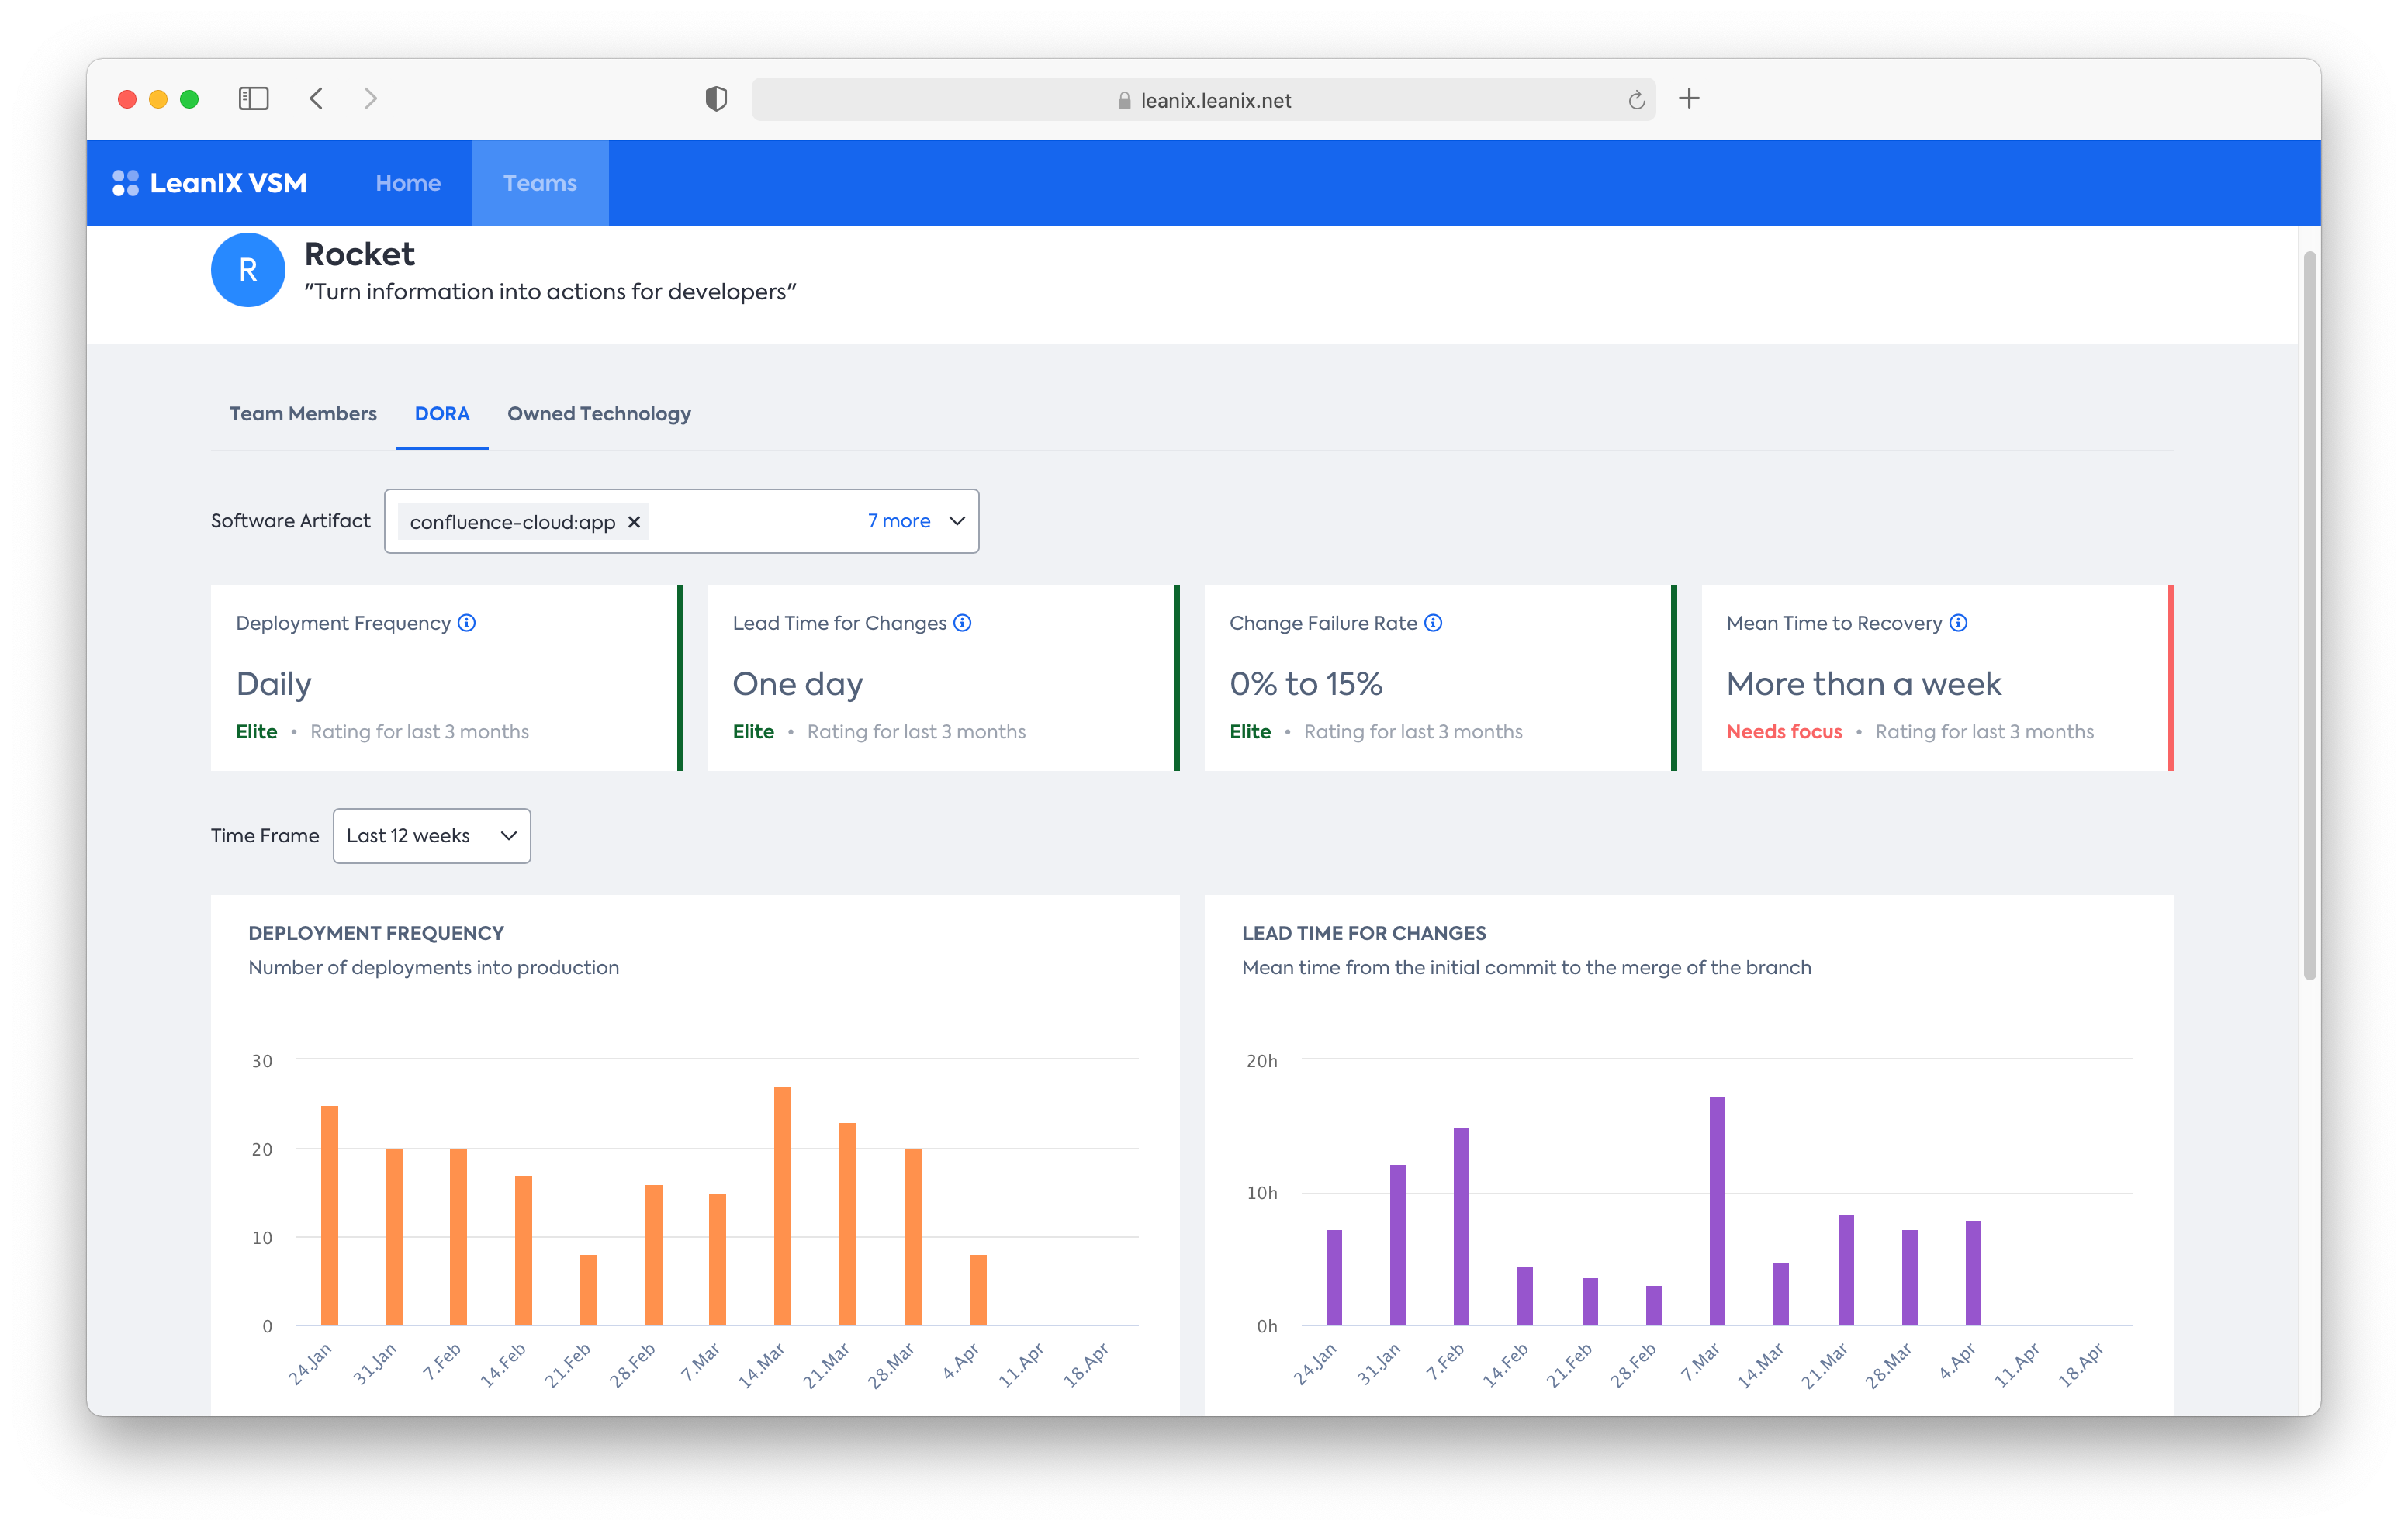
you are directed to the new team's page that focuses on the team members, DORA metrics, and owned technologies in the respective tabs.

All events from the Software Artifacts that a team contributes to are aggregated to display the four DORA metrics (Deployment Frequency, Lead Time for Changes, Change Failure Rate, and Meant Time for Recovery) in bar charts.
Atop the metrics, we provide opinionated performances badges indicating your team’s performance compared to industry peers with the categories elite, good, OK, needs focus.
Curious to try it out yourself? Go to your VSM workspace or try our VSM trial.