- DATE:
- AUTHOR:
- SAP LeanIX Product Team
Weekly feature improvement and bugfix summary
Inventory
We have made three bug fixes in the inventory:
When a fact sheet has many tags assigned, the tags section in edit mode previously grew upward past the navigation bar, cutting off the top rows. The tags section now stays within the page regardless of how many tags are assigned.
Active filters with long fact sheet names now truncate with an ellipsis in the filter bar, rather than expanding beyond the edge of the screen.
In the table view, rows now load correctly when opening a saved bookmark. Previously, only the first page of results appeared, and scrolling down did not load additional rows.
Reports
We have made a bug fix and an improvement to reports:
Custom reports are now available when adding a report panel to a dashboard, a presentation, or via widget integrations such as Confluence and HTML iframe exports. We fixed an issue that had previously prevented them from being included in these contexts.
AI agents and users can now generate more complete report deeplinks. Report URLs support additional display settings across landscape, matrix, and roadmap reports, including sort order and report title. See the report URL parameter reference for all available parameters.
Architecture decisions
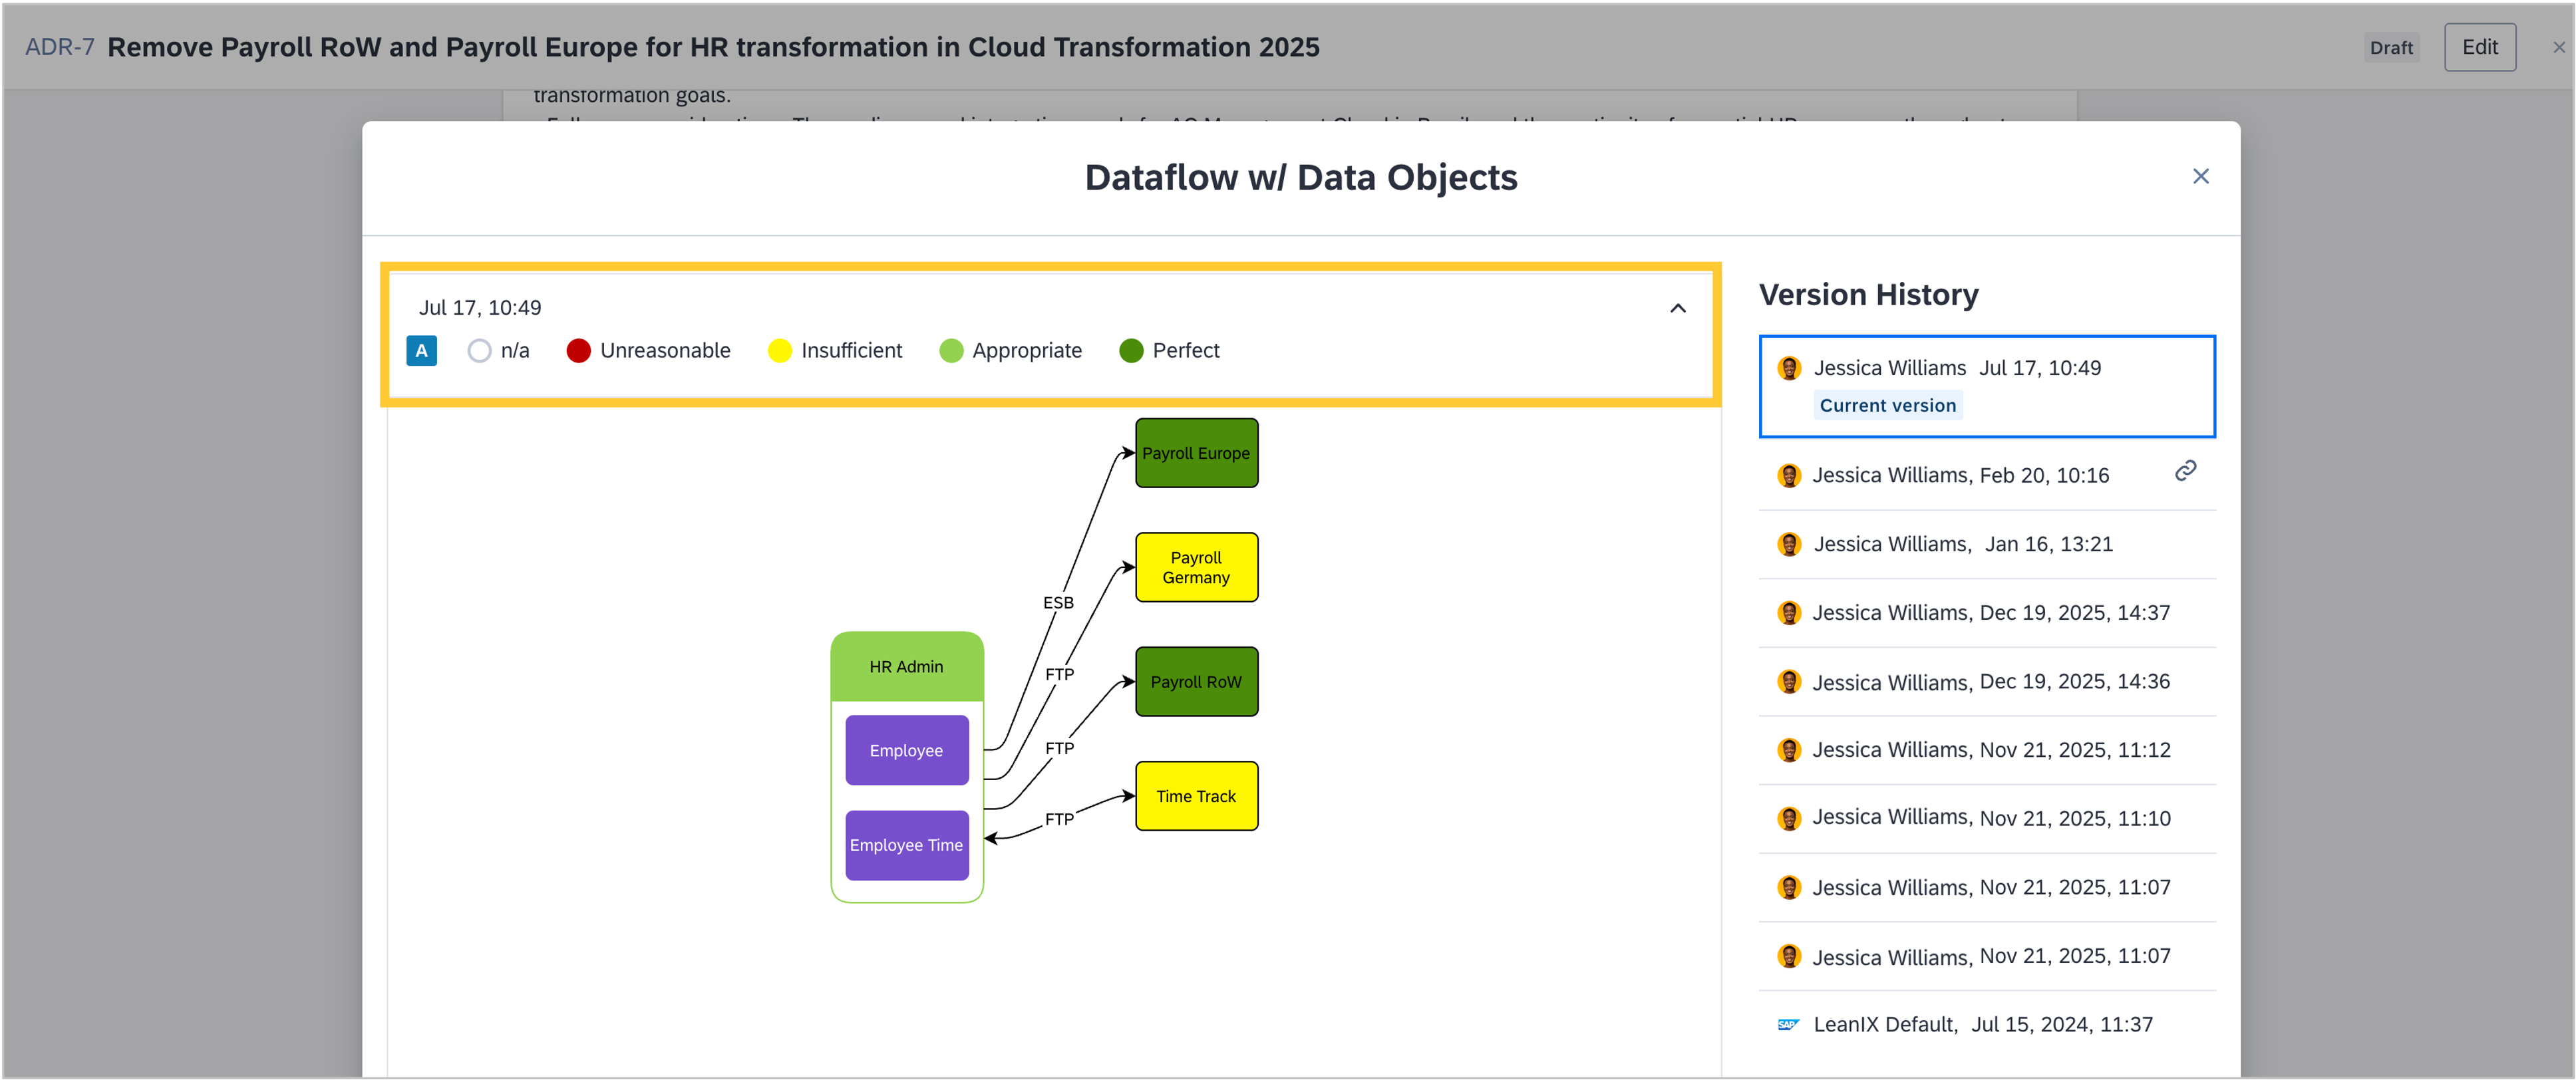
When reviewing an architecture decision that has a diagram attached, the version history picker now shows past diagram versions exactly as they appeared at the time, including any applied legends. In workspaces with SAP Architecture and Road Map Planning, transformation overlays are also shown. Previously, the picker displayed a stripped-down preview, making it difficult to assess what a previous version actually looked like.
Enterprise Architecture Assistant
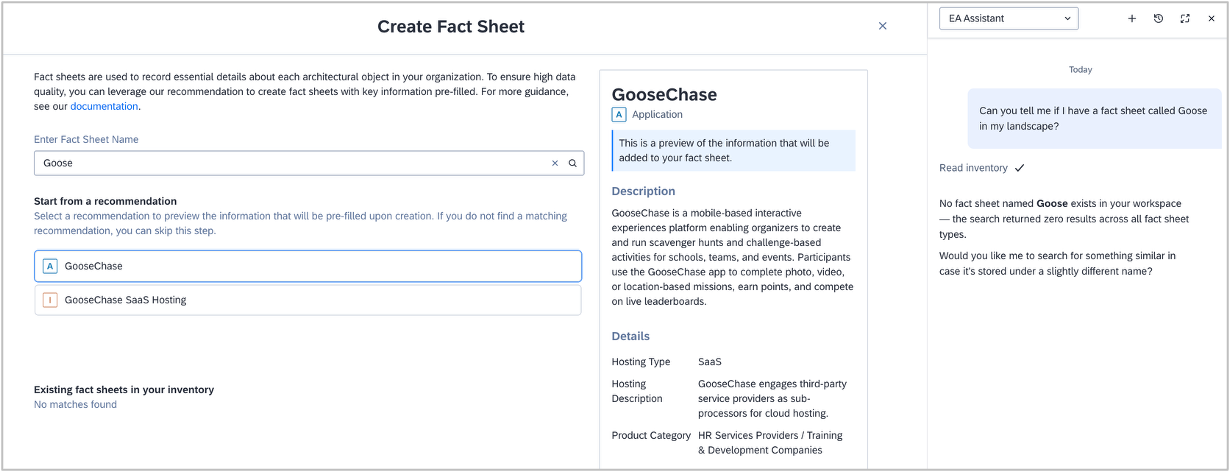
The Enterprise Architecture Assistant now stays visible when you open a full-screen view. Previously, opening expanded views, such as the fact sheet or diagram creation, covered the assistant panel, so you could no longer see both at the same time. The assistant now renders side-by-side with full-screen views so you can keep your context while working.
Reference catalog
You can now explore SAP reference business capabilities and SAP solution recommendations directly from your MCP client, without being limited to what the workspace UI surfaces. You can ask questions like “Based on my industry, suggest a set of business capabilities from the SAP reference” or “For my finance business capabilities, recommend a target architecture of SAP applications.” This is unlocked by new tools in the optional catalogs MCP toolset. The tools let you browse business capabilities by industry and hierarchy and look up which SAP applications and solution components can support them. They support exploration only and do not create or update fact sheets. For writing to fact sheets, you can (with the help of AI) call the appropriate APIs or prepare an Excel file for import. To activate it, see the SAP Help Portal.
Integrations
You can now preserve more project context from Jira in your initiative fact sheets by mapping additional fields. The Jira integration now supports work item status, work item key, and custom fields such as priority, t-shirt size, and region. See the SAP Help Portal for a full list of available fields.
Calculations
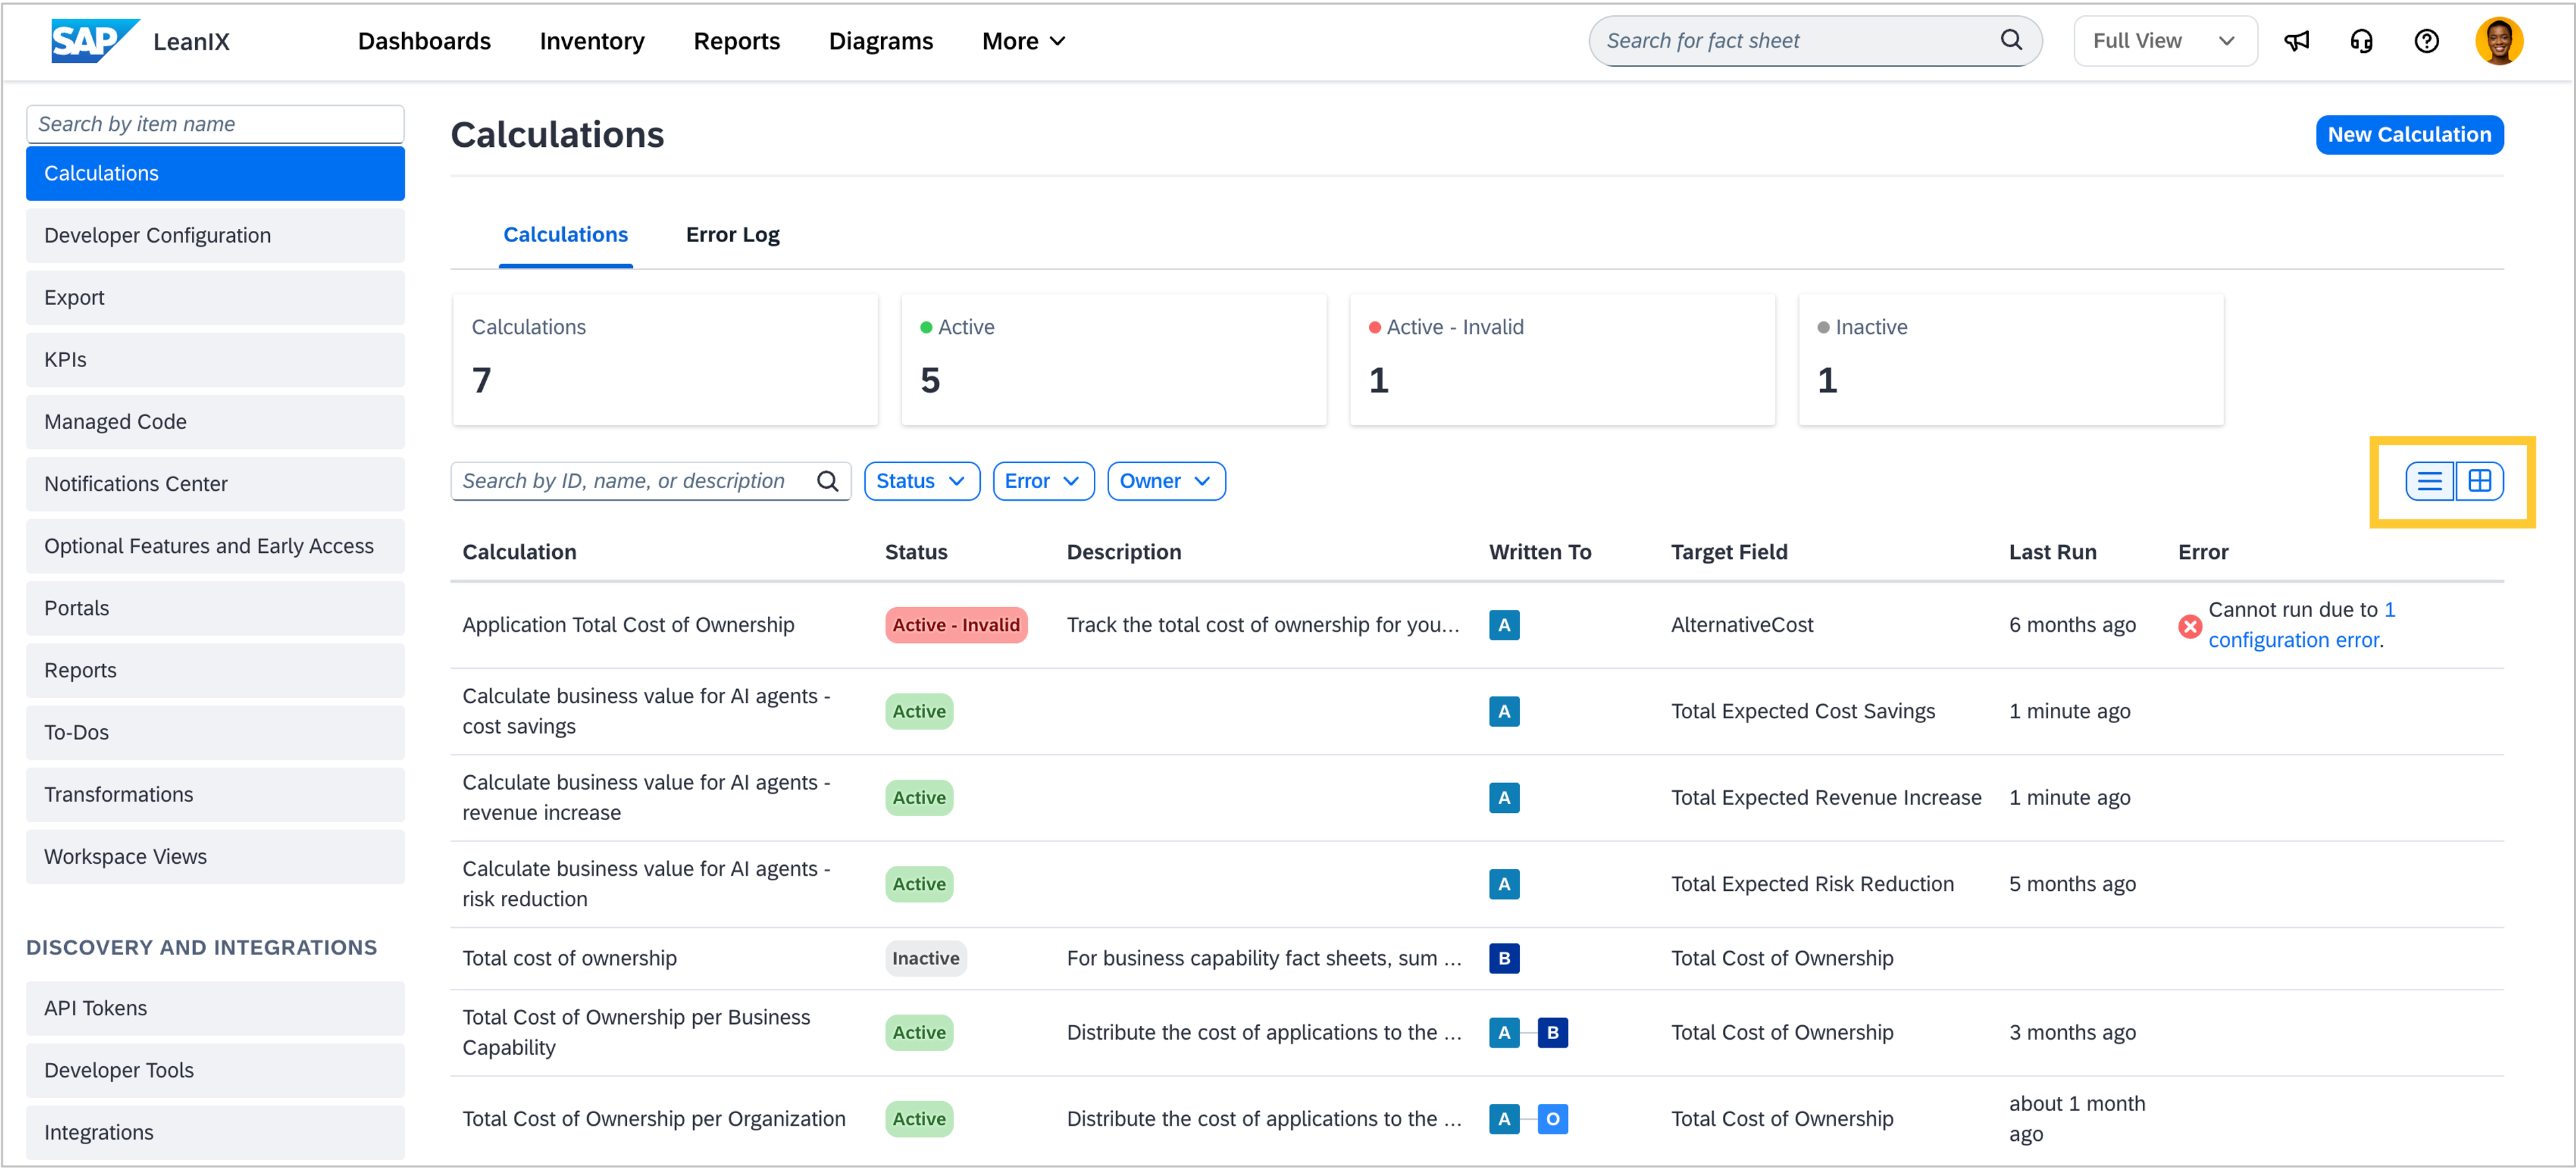
All your calculations are now available in a single table view in the administration area, making it faster to scan, manage, and troubleshoot them. The table shows name, status, description, target field, last run time, and any errors in one place. For workspaces with more than 9 calculations, the table view is the default. You can switch between table and card view at any time.
Meta model configuration
As an admin, you can now create subsections in the meta model configuration without first selecting an existing section. We fixed a bug where the “Add a subsection” button did not respond unless another section was already selected.
AI governance
We fixed an issue where the AI governance settings page did not appear in the administration area after activating the AI Governance extension. The page is now accessible immediately upon activation, as expected.
Extension hub
Three new custom reports are now available in the extension hub, each pulling live workspace data at runtime with no manual configuration required.
Inventory explorer gives you a clear picture of how your architecture is connected. Select a primary fact sheet type and the report maps relationships dynamically from your meta model as an interactive Sankey flow diagram, using live data.
Fact sheet resource manager helps you keep resources across your fact sheets organized and up to date at scale. It brings all linked resources into a single inbox-style view, where you can manage links, files, logos, and diagrams per fact sheet, or apply bulk actions across multiple fact sheets at once, which makes it well-suited for cleanup and migration work. For system fact sheets, the relevant SAP for Me link is suggested automatically based on the system number.
SAP landscape explorer gives you visibility into your SAP system dependencies at a glance. It shows how your SAP systems connect across platforms, providers, IT components, applications, and interfaces as an interactive Sankey diagram, generated from your SAP Discovery inbox data.
If you would like to build a report tailored to your own use case, you can create custom reports with your AI assistant without any coding experience.